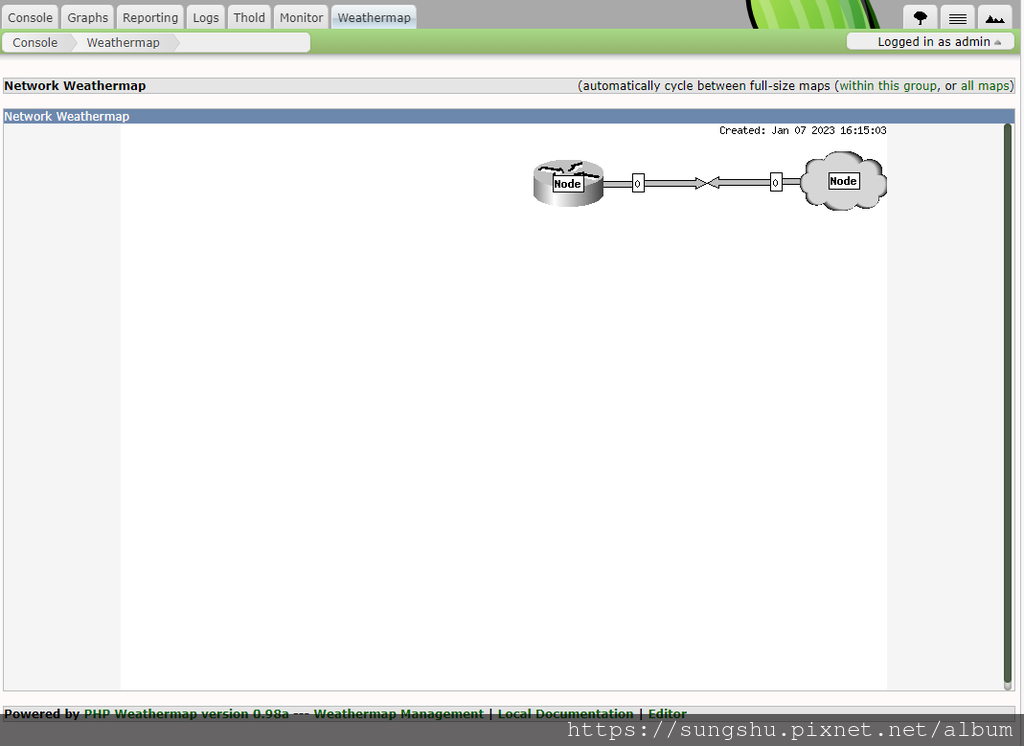
Network Weathermap 是 Cacti 的其中一項常用的 Plugin,其功能是將網路流量以圖形化來做表示。
管理者從 Cacti 就可看出目前圖形化流量非常好用主要安裝Cacti 也就是為了這個
按圖施工吧
cd /var/ww/html/plugin
sudo git clone https://github.com/Cacti/plugin_weathermap weathermap


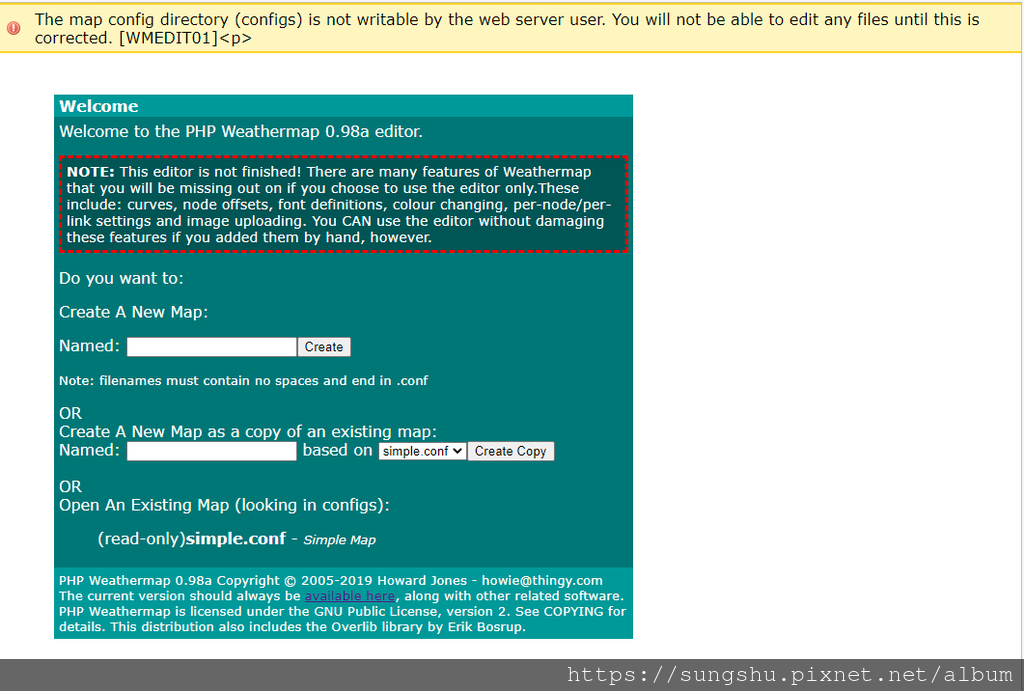
安裝完點擊建立MAP 會出現錯誤

sudo chown -R apache:apache /var/www/html/plugins/
sudo chmod 777 /var/www/html/plugins/weathermap/configs/ -R
sudo chmod 777 /var/www/html/plugins/weathermap/output/ -R

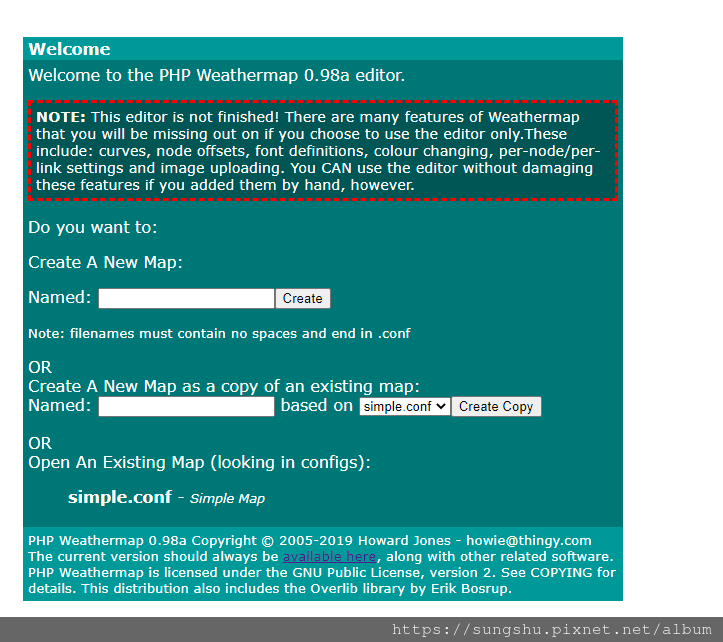
無錯誤後就可以建立圖示了

建立完後需要新增MAP至Weathermap網頁中

右上角 + 圖示

新增 剛剛畫的圖

回到設定頁面

等各五到十分鐘後正常應該會出現剛剛畫好的圖每五分鐘會更新一次


參考文章:
GitHub - Cacti/plugin_weathermap: Weathermap for Cacti 1.x
Network Weathermap | Open Source Network Visualisation (network-weathermap.com)
Cacti - Weathermap @ Coolking's CCNP 筆記 :: 痞客邦 :: (pixnet.net)
查修網路一目瞭然 用Weathermap強化Cacti | 網管人 (netadmin.com.tw)
Network Weathermap plugin for Grafana | Grafana Labs
Cacti-Weathermap automatically 即時刷新 (一分鐘) @ 『猴塞雷』的秘密基地 :: 隨意窩 Xuite日誌
Network Weathermap (@netweathermap) / Twitter


 留言列表
留言列表

 {{ article.title }}